
An insight into DBS Bank's latest Annual Report
 DBS recently issued its 2015 Annual Report. This is the fourth report following the guidance of <IR> since DBS became the first company in South East Asia to adopt <IR> in 2012. This year DBS will be fully compliant with the International Integrated Reporting Framework as well as the Global Reporting Initiative (GRI) Sustainability Reporting Guidelines.
The report has undergone many changes with an enhanced focus on ‘materiality’; ‘value creation’; the ‘business model’; and ‘stakeholder outreach’. One of the more innovative features in the report, I believe, is how the use of capitals (at DBS they are referred to as ‘resources’) is described.
DBS has taken the approach of trying to determine the value of our capitals and change in these values using – what I would call – a ‘balance sheet approach’. The idea broadly is that these capitals will have undergone a change in value during the year. The illustration on page 16 and 17 aims to capture this by showing proxies for the value of each capital as at the beginning and end of the year. The column between the ‘balance sheet figures’ is used to broadly explain the most important initiatives that have led to a change in value, giving a reference to further description elsewhere in the report.
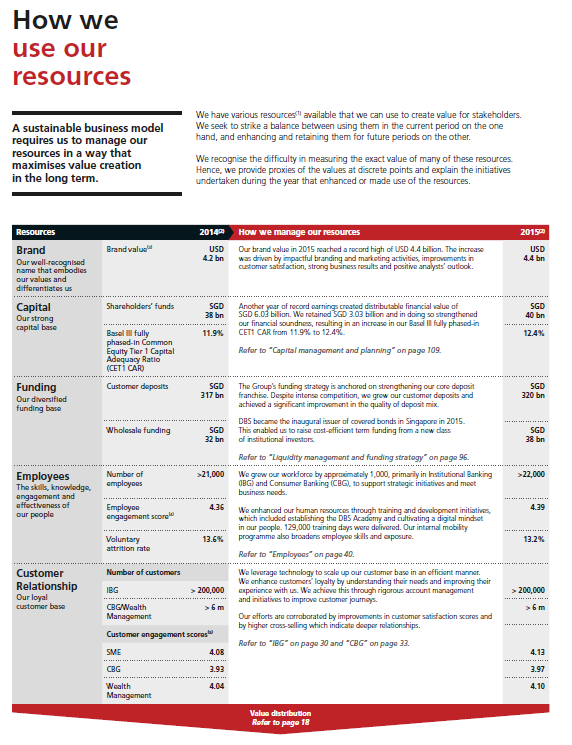
Theoretically the values shown would be monetary amounts in the same way as for the financial balance sheet. However, given the nature of the capitals, it is difficult to measure reliably these values. As an alternative, DBS has chosen to provide non-financial (or ‘pre-financial’) indicators that serve as proxies for the monetary amounts.
Other companies may take inspiration from this approach and even seek to go further in terms of providing a monetary amount for each capital, insofar as this does not become spuriously accurate. This would surely be a further step on the innovative approach the IIRC is promoting for reporting on capitals. Another challenge for companies may be to try to further explain how the use of resources is interrelated.
A couple of other things to note from DBS’ presentation is that we have chosen different categorization of the capitals (resources) than the six suggested by the <IR> Framework as these better fit DBS’ way of considering resources.
Also DBS is linking the change in value of capitals with the value distribution. The conceptual thinking here is that the value generated in a period can either be used to build up (or reduce) the value of capitals or can be distributed to stakeholders. In this sense, there is a direct conceptual linkage between value creation, capitals and value distribution.